Article Text

Abstract
BACKGROUND Helicobacter pylori, a human pathogen responsible for many digestive disorders, induces complex changes in patterns of gene expression in infected tissues. cDNA expression arrays provide a useful tool for studying these complex phenomena.
AIM To identify genes that showed altered expression after H pylori infection of human gastric cells compared with uninfected controls.
METHODS The gastric adenocarcinoma cell line AGS was cocultivated withH pylori. Growth of infected cells was determined by trypan blue exclusion assay. Complementary DNA probes derived from H pylori treated and untreated cells were hybridised to two identical Atlas human cDNA expression arrays, and those genes with altered expression levels were identified. A real time quantitative reverse transcription-polymerase chain reaction assay was used to better define expression patterns of these genes in endoscopically gastric mucosal biopsies with and withoutH pylori infection.
RESULTS Over 24 hours, coincubation with H pylori inhibited AGS cell growth but did not cause a noticeable degree of cell death.H pylori treatment altered the pattern of gene expression in AGS cells. We identified 21 overexpressed genes and 17 suppressed genes from the cDNA expression arrays. The majority of genes were transcription factors such asc-jun, BTEB2, andETR101. Other genes were involved in signal transduction pathways, such as MAP kinase, interleukin 5, and insulin-like growth factor. Genes involved in cell cycle regulation and differentiation, such as CDC25B andNM23-H2, were also identified. In patients with H pylori infection (n=20), there was a significant difference forERCC3, Id-2, andNM23-H2 mRNA levels in infected gastric mucosa compared with uninfected gastric mucosa in patients without peptic diseases (n=20) (ERCC3 4.75 molecules/104 β-actin mRNA moleculesv 13.65, p<0.001;Id-2 16.1 v 23.4, p<0.05; NM23-H2 17.5v 45.5, p<0.001). There was no significant difference between mRNA levels of c-jun andCDC25B in H pylori colonised gastric mucosa and uninfected mucosa.
CONCLUSION We demonstrated that H pylori infection caused alteration of gene expression in AGS cells. The differential hybridisation technique of Atlas human cDNA expression array is a useful method to identify host genes involved in pathogenic mechanisms in H pylori infection.
- gastric adenocarcinoma
- Helicobacter pylori
- cDNA microarray
- gene expression
- transcription factors
- signal transduction pathway
Abbreviations used in this paper
- VacA
- vacuolating toxin
- IL
- interleukin
- FBS
- fetal bovine serum
- RT-PCR
- reverse transcription-polymerase chain reaction
- IL-5R
- interleukin 5 receptor
- IGFBP2
- insulin-like growth factor binding protein 2
Statistics from Altmetric.com
- gastric adenocarcinoma
- Helicobacter pylori
- cDNA microarray
- gene expression
- transcription factors
- signal transduction pathway
Helicobacter pylori, a human pathogen, infects gastric mucosa and causes many digestive disorders such as peptic ulcers, chronic gastritis, and gastric cancer.1 The virulence factors of H pylori include those allowing the bacterium to survive in the hostile environment of the gastric lumen, such as spiral shape and motility, adaptive enzymes and proteins, and ability to adhere to gastric mucosal cells and mucus.2 ,3 Additional factors considered as pathogenic mechanisms of H pylori include those causing disruption of the gastric mucosal barrier, such as vacuolating toxin (VacA), mediators of inflammation, and contributors to gastric acid.4-6 However, peptic ulcer diseases and gastric cancer occur in only a subset of individuals chronically infected with H pylori.Therefore, both bacterial and host factors are presumed to contribute to this differential response. Regarding the host cellular response, in vivo and in vitro studies have shown thatH pylori infection causes inflammation of gastric epithelium cells by increasing interleukin 8 (IL-8) expression and secretion.7-9 H pyloriinfection also increases pepsinogen secretion and may result in damage of epithelium integrity.10-12 Recent studies reported that H pylori caused apoptosis of infected epithelium cells.13-15 Moreover, they produce oxidative stress in gastric mucosa.16 ,17
Investigating gene expression of host cells during pathological changes that arise in diseases such as peptic ulcers and even cancer may provide the information we need to analyse the biological processes induced by H pylori infection. In a previous study, we demonstrated that H pylori induced alteration of gene expression in human gastric cells using the technique of mRNA differential display.18 cDNA expression array is a new technology which offers high throughput screening of the differential expression of many genes in pathogenic cells.19 This technology is based on the principle of reverse northern hybridisation.20 Hundreds to tens of thousands of DNA fragments are fixed on support material such as nylon membranes or glass slides. Genes with different expression levels can be identified by comparing two or more duplicate arrays hybridised with cDNA probes derived from different samples. Until now, cDNA expression arrays have been used to study differentially expressed genes in several types of cancers.21-24 The technology also has potential for studying other cellular behaviours, such as differentiation and drug response.25 ,26
In this study, we used a cDNA expression array assay to analyse alterations in gene expression in cultured gastric epithelium cells after H pylori infection. Of the altered genes, only a small proportion have previously been identified, such as those for cytokine expression, apoptosis, and signal transduction. Many other genes have not been studied in relation to H pylori induced responses. In this study, the possible functions of these genes and their relationship to disease is discussed.
Patients and methods
PATIENTS
Gastric biopsies were obtained from 20 H pylori negative patients (10 men and 10 women) and 20H pylori positive patients, including 16 with duodenal ulcer (10 men and six women) and four with gastric ulcer (two men and two women). Biopsies were frozen in liquid nitrogen until use. Diagnosis was made based on endoscopic examination, histological examination of gastric biopsy, and the rapid urease (CLO) test.
BACTERIUM AND CELL LINE CULTIVATION
The H pylori strain K8, positive for VacA and CagA, was isolated from an ulcer patient at Chang Gung Memorial Hospital, Taiwan. The bacterium was cultured on chocolate agar plates at 37°C in a microaerophilic atmosphere of 10% CO2 in air and 95% humidity. The human gastric adenocarcinoma cell line AGS (CCRC 60102) was obtained from the Food Industry Research and Development Institute, Taiwan. AGS cells were cultured in Ham's F12 medium (GibcoBRL, Grand Island, New York, USA) containing 10% fetal bovine serum (FBS) (Trace Bioscience, Australia) and grown in an incubator at 37°C with 5% CO2 in air.
COCULTIVATION OF H PYLORI AND AGS CELLS
Prior to the experiment, H pylori were scraped from agar plates, washed once with phosphate buffer saline, and resuspended in serum free F12 medium. The concentration of bacterium was adjusted to 1×10⁸ cells/ml, as measured under a microscope on a haemocytometer and by spectrophotometry at 625 nm. AGS cells were seeded on 100 mm dishes 18 hours before bacterial cells were added. To determine cell growth rate, 5×10⁵ AGS cells were treated with 1×10⁸ or 2×10⁸ bacterial cells in 5 ml of medium without antibiotics. Cells were trypsinised after 24 and 96 hours, and cell numbers and their viability were measured on a haemocytometer by trypan blue exclusion. For RNA extraction, 2×10⁶ AGS cells were coincubated with 2×10⁸ bacteria in 10 ml of medium. Cells treated with an equal volume of bacterium free medium served as controls. After 24 hours, 2×10⁷ cells were collected, washed three times with phosphate buffer saline, and lysed in TRIzol reagent (GibcoBRL).
EFFECT OF H PYLORI ON AGS CELL APOPTOSIS
Synchronised AGS cells cocultured with H pylori were analysed in parallel with cells grown in the absence of microorganisms to determine effects on cell apoptosis. Synchronised AGS cells were serum deprived for 48 hours. Adherent and floating cells were collected together and fixed in 70% ethanol. Cell pellets were suspended in 400 μl of 0.2 mg/ml propidium iodide containing 0.6% NP40 (ICN Pharmaceuticals, Costa Mesa, California, USA) with the same volume of 2 mg/ml RNase (Sigma Chemical Co, St. Louis, Missouri, USA) and incubated in the dark at room temperature for 30 minutes. Cell suspensions were filtered through a 60 μm mesh filter. Data acquisition and analysis were performed on a FACScan instrument (Becton Dickinson, San Jose, California, USA). Apoptotic cells were considered to constitute the sub-G1 cell population. All experiments were performed at least three times.
COMPLEMENTARY DNA PROBE PREPARATION AND HYBRIDISATION OF HUMAN DNA EXPRESSION ARRAY
To the TRIzol lysed cells, a 0.2 volume of chloroform was added and the aqueous phase containing RNA was collected after centrifugation. RNA was precipitated in 50% isopropanol and the pellets were washed with 70% alcohol, dried, and resuspended in diethylpyrocarbonate treated H2O. Poly A+ mRNA was isolated from 500 μg of total RNA using oligotex mRNA kits (Qiagen, Hilden, Germany). cDNA probe preparation and membrane hybridisation were performed according to the manufacturer's instructions for Atalas human cDNA expression array (Clonetech, Palo Alto, California, USA). Briefly, 1 μg of mRNA was reverse transcribed into cDNA by MMLV reverse transcriptase in the presence of CDS primer mix and α 32P-dATP (3000 Ci/mmol; Amersham Pharmacia, Hong Kong). Labelled cDNA was separated from unincorporated nucleotides using a CHROMA SPIN-200 column (Clonetech). The human cDNA expression arrays were prehybridised at 68°C for 30 minutes in ExpressHyb solution (Clonetech) to which 0.1 mg/ml of salmon sperm DNA (GibcoBRL) had been added. cDNA probes were hybridised to the arrays at 68° C overnight. Membranes were washed four times with solution 1 (2× SSC and 1% SDS) and twice with solution 2 (0.1× SSC and 0.5% SDS) for 30 minutes at 68°C in all cases and exposed to a phosphor screen. The images and quantitative data of gene expression levels were analysed using PhosphoImager (Molecular Dynamics, Sunnyvale, California, USA).
NORTHERN BLOTTING
For northern blots, total RNA (10 μg) obtained from untreated AGS and H pylori treated AGS cells were separated on formaldehyde denaturing 1% agarose gels and transferred to nylon membranes (Schleicher and Schuell, Hahnestrasse, Germany). After UV cross linking, blots were prehybridised at 40°C in 1× SSC, 1% SDS, 1× Denhardt's solution, 200 μg/ml of salmon sperm DNA, and 20 mM Tris buffer (pH 7.1) for four hours. Hybridisation was continued at 40°C overnight in the presence of 1×10⁶cpm/ml of random prime 32P labelled probe. After washing at room temperature in 2× SSC/0.1% SDS, blots were washed at 65°C for 20 minutes with 1× SSC/0.1% SDS. The washed membrane was autoradiographed for six hours. Temporal changes in expression of genes in H pylori treated and untreated AGS cell lines were studied by northern hybridisation analysis. For the loading control, bolts were stripped and reprobed with a 32P labelled human β-actin gene probe. The probes for the genes were made by reverse transcription-polymerase chain reaction (RT-PCR) using specific primer sets. Complementary DNA was synthesised from 2 μg of total RNA in a 25 μl reaction mixture containing 1× reverse transcriptase reaction buffer (Promega, Madison, Wisconsin, USA), 200 μM of dNTPs, 10 ng of oligo (dT)15 primer, 8 mM dithiothreithol, 40 U of Rnasin (Promega), and 100 U of M-MLV reverse transcriptase (Promega). The mixture was incubated at 37° C for 50 minutes, heated to 80°C for 10 minutes, and chilled on ice. Amplification of each specific gene was performed using a 2 μl aliquot of cDNA in a 50 μl amplification mixture containing 200 mM dNTPs, 0.2 μM forward and reverse primers, 2.5 U of Taq DNA polymerase, and 1× Taq reaction buffer. For β-actin, PCR amplification was performed for 22 cycles (94°C for 30 seconds, 50° C for 30 seconds, 72°C for 30 seconds) after a first denaturing step (94°C for two minutes). For the other genes, PCR amplification was performed for 25–30 cycles (94°C for 30 seconds, 60° C for 30 seconds, 72°C for 30 seconds). The specific primers used for PCR were as follows: 5′-CCGAAGGCTA GTGCGATGTTTC-3′ and 5′-ACTTGATG CAATCCAAACTTTGAA-3′ for c-jun; 5′-AGATTTACCCTGTGGATCTGTCACT-3′ and 5′-TCATCACAGAGACTTTCAC AAG CAA-3′ for EERC3; 5′-ATATCAGCATCC TGTCCTTGCA-3′ and 5′-GAAA TCA TG AACACCGCTTATTCA-3′ for Id-2; 5′-CTG AACCTTGTGGATTGGAGTTC-3′ and 5′-AAAAGCTGCAGGATGTCACCA-3′ for p55 CDC; 5′-CAGTAGACGGAAAGCACCAAG A-3′ and 5′-AATCACAAACTTATCCACGAT GTTG-3′ forCDC25B; 5′-ACCTGAAAGA CCGACCATTCTTCC-3′ and 5′-AGACTGC TGTTGTGTCCACCTC-3′ for NM23-H2; and AAGATGACCCAGATCATGTT-3′ and GCGACATAGCACAGCTTCT-3′ for β-actin. After amplification, PCR products were separated on a 2.5% agarose gel and stained with ethidium bromide.
QUANTITATIVE PCR
Total RNA was isolated from frozen gastric mucosal biopsy samples using TRIzol separation. cDNA was prepared using the abovementioned method. Real time quantitative RT-PCR has been described previously.27-29 All PCR reactions were performed with a hot start in triplicate in a GeneAmp 5700 Sequence Detection System (Applied Bioslystems, Foster City, California, USA). The reaction conditions were two minutes at 50°C, 10 minutes at 95°C, 40 cycles with 15 seconds at 95°C, and a final one minute incubation at 60°C and a final one minute for all templates.
The GeneAmp 5700 system (Applied Bioslystems, Foster City, California, USA) detected PCR product accumulation using SYBR Green I assay. SYBR Green I dye was added to bind the double stained DNA formed during the PCR reaction, and binding causes an increase in fluorescence. Based on SYBR Green I assay chemistry, the increase in fluorescence is proportional to the DNA concentration. All PCR reactions were performed in special optical tubes in a 96 well microtitre plate format. Serial dilutions of cDNA standards in triplicate with known amounts of input cDNA and “no template” negative controls were added to the microwells to perform PCR. Intra- and interassay variability were less than 3 %. The transcripts of β-actin were quantified as endogenous RNA control. Then, the target gene amount was divided by the endogenous β-actin amount to obtain a normalised target gene value.
STATISTICAL ANALYSIS
The Students's t test was used for statistical analysis. Results were considered significant at p<0.05.
Results
CELL GROWTH AND APOPTOSIS
Treatment with H pylori markedly inhibited the growth of AGS cells. However, little or no cell death was detected within 24 hours by trypan blue exclusion assay. Extending the incubation time to 72 hours caused half of the H pylori treated cells to become detached and resulted in a decrease in the number of living cells. Therefore, AGS cells were treated with H pylori for 24 hours in this study
Spontaneous apoptosis occurred in 2–4% of exponentially growing AGS cells after a 24 hour incubation period, as assessed by subdiploid DNA peak analysis on flow cytometry. Addition of H pylori induced a threefold increase in the percentage of cells in the sub-G1 (apoptotic) population in exponentially dividing cells after 24 hours of incubation (fig1).

Apoptosis fraction of AGS cells at different times after coculturing with H pylori. Synchronised AGS cells were serum deprived for 48 hours (time 0 hours) and fed with fresh medium containing 10% fetal bovine serum (FBS) alone or combined with wild-type H pylori at a bacterial concentration of 107cells/ml. The experiments were repeated three times.
RNA EXPRESSION PATTERN IN H PYLORIINFECTED AGS CELLS
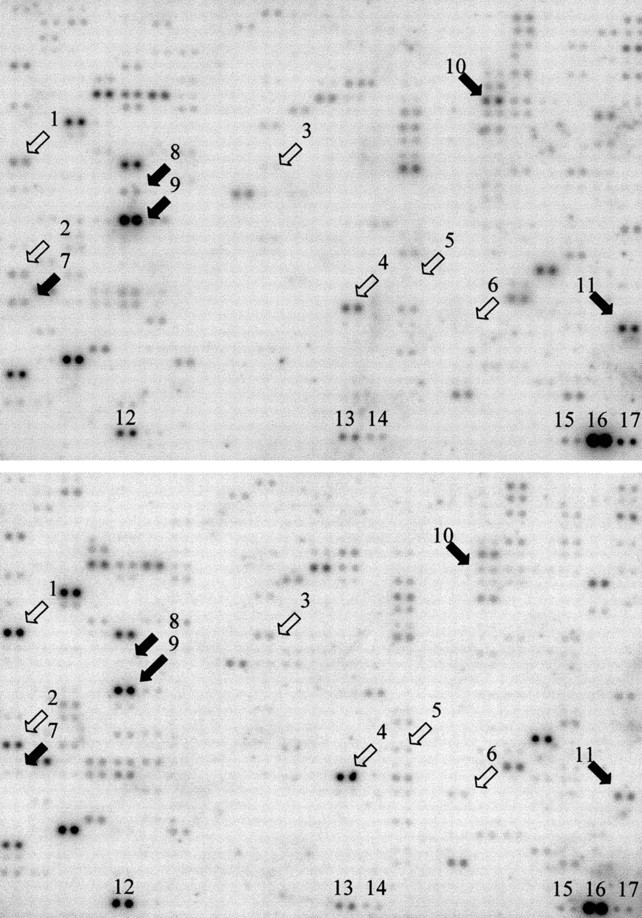
The Atlas human cDNA expression array is a positively charged nylon membrane on which DNA fragments representing 588 genes, nine housekeeping genes, and negative control sequences were spotted in duplicate dots. cDNA probes derived from H pylori treated AGS cells were hybridised to a membrane. The probes derived from untreated cells were hybridised to another identical membrane. mRNA extracted from AGS cells for cDNA preparation was quantified using a spectrophotometric method (ratio of 260 nm/280 nm). For several genes, changes in expression levels afterH pylori infection were identified by comparing hybridisation patterns on the two membranes (fig 2). We stripped and rehybridised the cDNA array membranes at least three times and found similar results. Table 1 shows that 21 genes were upregulated and 17 genes were downregulated after AGS cells were coincubated withH pylori. Only those genes demonstrating greater than twofold alterations are listed. Nine housekeeping genes were used as internal controls to correct the mRNA abundance. Among these housekeeping genes, gapdh,tubulin α,β-actin, gene of 23 kDa highly basic protein, and gene of ribosomal protein S9, which showed similar relative intensities of signals in both hybridised membranes, and the mean of the signals of those control genes were used to normalise the target genes. The signals of other housekeeping genes (hprt, phospholipase A2, and MHC) were either not detected or too weak to act as a useful reference. No detectable signal appeared at the sites of M13, λ-DNA, and pUC18 DNA, which served as negative controls for DNA contamination of sample.

Gene expression pattern after 24 hours of H pylori cocultured AGS cells appearing on the Atlas human cDNA expression arrays. Upper and lower arrays were hybridised with the cDNA probes derived from untreated and H pylori treated AGS cells, respectively. Some of the differentially expressed genes are marked. Open arrows indicate genes that were overexpressed by H pylori treatment; black arrows indicate downregulated genes. 1, c-jun; 2, BTEB2; 3, MAPk/ERK kinase; 4, α-catenin; 5, fibronectin receptor α subunit; 6, epidermal growth factor; 7, Id-2; 8, p55CDC; 9, nuclease sensitive element DNA binding protein; 10, NM23-H2; and 11, death associated protein 3. Internal controls were: 12, ubiquitin; 13, gapdh; 14, tubulin; 15, β-actin; 16, 23 kDa highly basic protein; and 17, ribosomal protein S9.
Alteration of gene expression in AGS cells after cocultivation with Helicobacter pylori for 24 hours
NORTHERN BLOT ANALYSIS
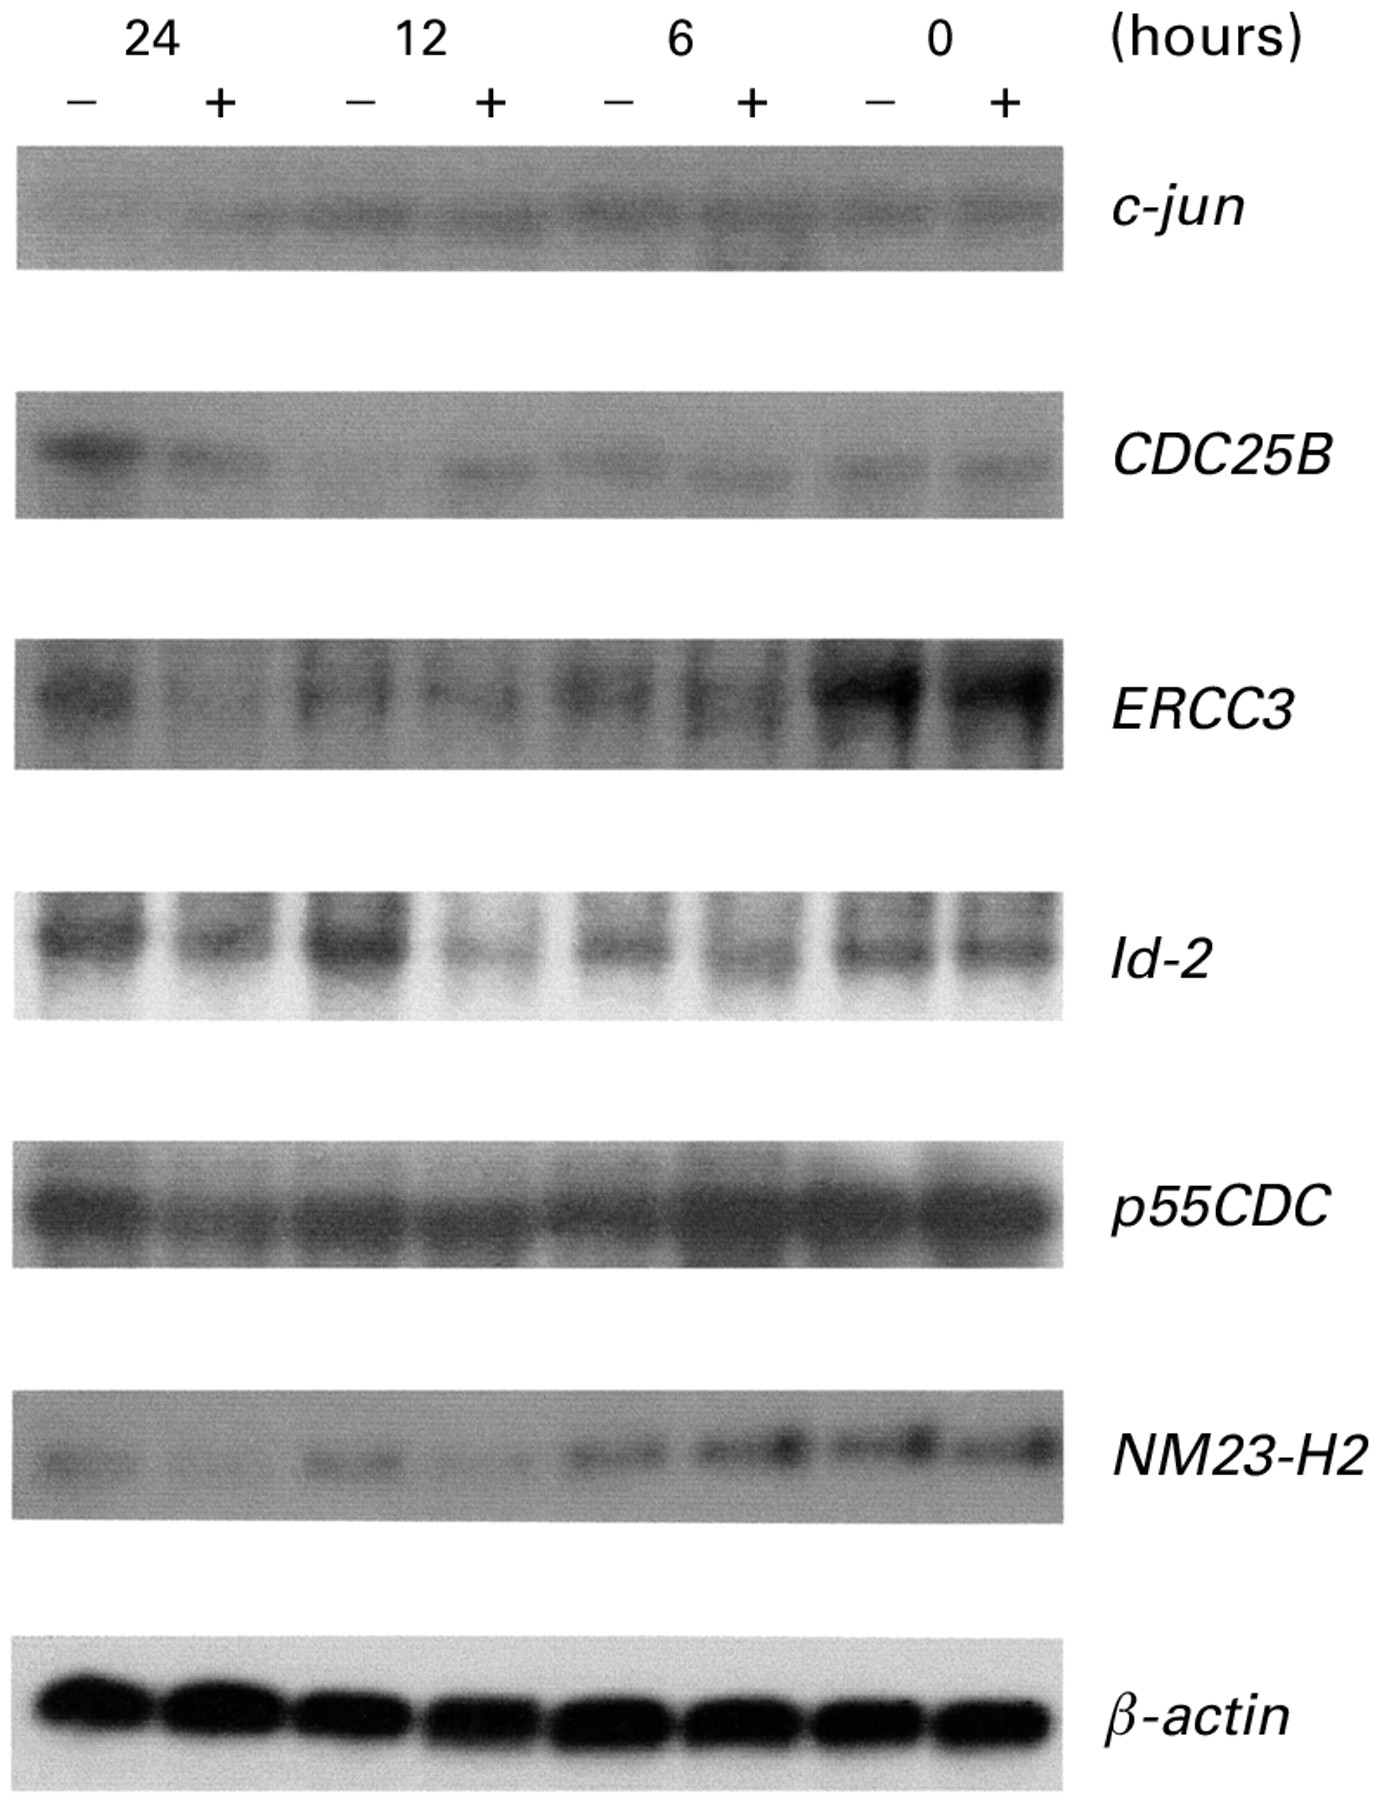
To confirm the differential expression of genes identified on the cDNA expression arrays, an independent experiment ofH pylori treatment was repeated, and total RNAs derived from 24 hour H pylori treated and untreated AGS cells were subjected to RT-PCR preparation for six probes (c-jun,CDC25B, ERCC3,Id-2, p55CDC, andNM23-H2). Northern blot analysis revealed that sizes of c-jun,CDC25B, ERCC3, Id-2, p55CDC, andNM23-H2 were approximately 4.8, 4.8, 5.6, 5.8, 4.6, and 3.7 kb, respectively. As shown in fig 3, the time course of northern blotting confirmed that candidate gene expression in AGS cells was changed by H pylori treatment. In untreated AGS cells, c-jun mRNA levels were decreased at 24 hours. However, expression of c-junwas maintained for 24 hours in H pyloritreated AGS cells. CDC25B levels in the control AGS cells were decreased at 12 hours and recovered at 24 hours, but in H pylori treated AGS cells gene expression was unchanged after 24 hours. ERCC3and P55CDC expression was significantly decreased at 24 hours by H pylori treatment. Id-2 expression was decreased within 12 hours of H pyloritreatment and recovered at 24 hours. NM23-H2was significantly decreased within 12 hours ofH pylori treatment and was quantified at 250% of control levels.

Northern blot demonstrating changes in expression of ERCC3, Id-2, NM23-H2, c-jun, and p55CDC at specified time intervals after coculturing AGS cells with H pylori at 107 cells/ml for 24 hours. RNAs were purified at the indicated times, and 10 μg of total cellular RNA was loaded into each lane. The same blot was hybridised to one probe, retrieved, and rehybridised sequentially with the other probes. Three independent experiments were performed and similar result were obtained.
QUANTITATIVE RT-PCR ANALYSIS OF CANDIDATE GENES FROMH PYLORI INFECTED AND UNINFECTED GASTRIC MUCOSA
A significant decrease in ERCC3 mRNA levels was observed in the group of patients with H pylori infected gastric mucosal biopsies (mean 4.75 mRNA molecules/104 β-actin mRNA molecules; range 1.4–8.5) compared with uninfected mucosa (mean 13.65 mRNA molecules/104 β-actin mRNA molecules; range 8.4–25.9) (p<0.001) (fig 4). A significant decrease in Id-2mRNA levels was also observed in H pylori infected gastric mucosal biopsies (mean 16.1 mRNA molecules/104 β-actin mRNA molecules; range 10.4–19.3) compared with normal mucosa (mean 23.4 mRNA molecules/104β-actin mRNA molecules; range 20.1–35.6) (p<0.05). Expression ofNM23-H2 was significantly decreased inH pylori infected gastric mucosal biopsies (mean 17.5 mRNA molecules/104 β-actin mRNA molecules; range 10.4–19.3) compared with normal mucosa (mean 45.5 mRNA molecules/104 β-actin mRNA molecules; range 30.1–60.6) (p<0.001). Although in H pylori colonised mucosa CDC25B and c-junmRNA levels were altered, no significant difference was seen in gene expression between infected and uninfected mucosa (fig4).

mRNA levels of ERCC3, Id-2, NM23-H2, c-jun, and p55CDC in human gastric mucosal biopsies. mRNA amounts were quantified using a real time quantitative reverse transcription-polymerase chain reaction technique, as described in patients and methods. For each group data were summarised using the box plot technique. The bottom and top symbols indicated minimum and maximal values, respectively (lower or higher than 10% and 90% percentiles); the filled square in the box indicates the mean; and the bottom of the box, median line, and top of the box indicate 25%, 50%, and 75% percentiles, respectively. + and − indicate H pylori infected and uninfected biopsies, respectively.
Discussion
Cell lines or primary cultures coincubated with bacterium or treated with bacterial components are frequently used as a model to study the pathogenic mechanisms of H pylorirelated diseases. The cellular responses induced by such treatment include growth inhibition, vacuolation, apoptosis, cytokine secretion, and rearrangement of the cytoskeleton.7 ,30-32 However, it is still difficult to establish a direct link withH pylori induced diseases from these effects, and the possibility that other mechanisms may be responsible for the diseases cannot be excluded. Therefore, a comprehensive investigation of the cellular responses to H pylori is necessary.
In this study, we used cDNA expression array to monitor expression of hundreds of genes in AGS cells after coincubation withH pylori and found that there were changes in expression levels of 38 genes. The majority of the genes were transcription factors or putative transcription factors. Among themc-jun,fra-1, PAX3,BTEB2, TTP,DB1, ETR101, andETR103 were overexpressed andId2,TFIID, TFIIH-p89,NM23-H2,Ini1, HSF1, and gene of CCAAT displacement protein were downregulated. Differential expression of transcription factors may be an early response toH pylori infection because these factors influence expression of other genes and then change cellular behaviour. Among the transcription factors with elevated expression, C-JUN and Fra-1 are two components of the transcription factor AP-1. AP-1 has a binding site in the promoter region of IL-8, and expression of IL-8 could be partially affected by AP-1.33 Several lines of evidence have proved that IL-8 production by cells was stimulated by H pylori treatment.7-9 Moreover, an increase in AP-1 activity is an early event in cell apoptosis.34 Since prolonging the incubation time of AGS cells with H pylori (over 96 hours) causes cell death, AP-1 activity may play a role in H pylori induced cell death. Interestingly, some of the H pylori induced transcription factors, such as c-jun,TTP, ETR101, andETR103, are also mitogen inducible,35-38 suggesting that at least part of theH pylori induced response is shared with mitogen mechanisms. In contrast, TFIID andERCC3, which are associated with basic transcription, were downregulated by H pylori. This phenomenon may be due to the inhibited growth of the cells after H pylori treatment.
Some signal transduction pathways can change the activities of transcription factors and their expression. Although the signalling mechanism was not observed directly in the present study, we found clues from the differential expression of the related genes. For example, our results indicated that expression ofMLK-3,MAPKK3, MAPKK4,ERK kinase 1, and c-jun increased after cells were treated with H pylori, indicating that the MAP kinase pathway plays a role inH pylori induced responses. In contrast, expressions of interleukin 5 receptor (IL-5R) and insulin-like growth factor binding protein 2 (IGFBP2), which modulate the effects of IL-5 and insulin-like growth factor, respectively, were suppressed by the bacterium. While the physiological inference of IL-5R and IGFBP2 is unclear, cells may change their susceptibility to stimuli by altering the number of factors that are involved in signalling pathways.
Two cell cycle related genes, CDC25B andp55CDC, were downregulated byH pylori infection. CDC25B, a tyrosine phosphatase, is required for cell cycle progression to mitosis.39 It has been reported that phorbol 12-myristate 13-acetate suppresses expression of CDC25Band causes G2 arrest in endothelial cells.40 Our results showed that H pylori inhibited cell growth but did not cause cell death during the coincubation period of 24 hours. This growth inhibition may be related to downregulation ofCDC25B, as evidenced by the fact that coincubation of AGS cells with H pyloricaused G2 arrest (unpublished observation).
The microtubule association protein p55CDC is essential for cell division.41 Depletion of p55CDC by antibody injection causes arrest or delay at the metaphase and impairs progression of late mitotic events.42 Downregulation ofCDC25B and p55CDCsuggests that H pylori disturbs the cell cycle. Previous studies have confirmed that before apoptosis, UV treated cells suffer cell cycle arrest.43 This raises the question of whether H pylori induces apoptosis via a similar mechanism. Downregulated levels ofNM23-H2, a metastasis suppressor gene, were also observed in H pylori treated AGS cells. Increasing evidence suggests thatNM23 genes, initially documented as suppressors of the invasive phenotype in some cancer types, are involved in the control of normal development and differentiation.44
H pylori suppressed two stress inducible genes, the heat shock protein 27 and the heat shock factor protein 1, and a detoxification related gene, glutathione S-transferase T1. As expected, H pylori can potentially generate reactive oxygen molecules16 ,17 which may cause a stress environment in cells and induce stress genes. However, induction of stress genes was not observed in this study. It may be that oxidative stress was not generated under our cell culturing conditions or that the cellular response to the H pylori insult was not mediated by the stress proteins tested.
Using cDNA expression arrays to investigate gene expression, we found that for several genes in AGS cells, expression levels were changed after treatment with H pylori. This clearly indicates that multiple genetic changes and gene products are required for the pathogenesis of H pylori infection. Using the technique of gene specific quantitative RT-PCR, we demonstrated that the expression patterns ofERCC3, Id-2, andNM23-H2 genes analysed in human gastric mucosal biopsies were the same as those using the cDNA expression arrays. Expression of c-jun andp55CDC in H pyloriinfected and uninfected human gastric mucosa were different but not significant. The possible reason for this is either false positive results from the cDNA expression array assay or scarce amounts of those genes present in the gastric mucosa. We are currently analysing expression patterns of the rest of the target genes that were screened using this technique in H pylori colonised human gastric mucosa.
We conclude that differential hybridisation of human cDNA expression arrays can be a useful tool to identify potential genes involved in the pathogenic mechanism of H pylori.
Acknowledgments
Our research is supported by grant “NSC 89–2320-B-182–019” from the National Science Council, Taiwan, Republic of China.
Abbreviations used in this paper
- VacA
- vacuolating toxin
- IL
- interleukin
- FBS
- fetal bovine serum
- RT-PCR
- reverse transcription-polymerase chain reaction
- IL-5R
- interleukin 5 receptor
- IGFBP2
- insulin-like growth factor binding protein 2