Article Text

Abstract
Aims: In animals and humans increased expression of CCN3 (NOV) is detected in tissues where calcium is a key regulator, such as the adrenal gland, central nervous system, bone and cartilage, heart muscle, and kidney. Because the multimodular structure of the CCN proteins strongly suggests that these cell growth regulators are metalloproteins, this study investigated the possible role of CCN3 in ion flux and transport during development, control of cell proliferation, differentiation, and pathobiology.
Methods: The isolation of CCN3 partners was performed by means of the two hybrid system. Yeasts were cotransfected with an HL60 cDNA library fused to the transactivation domain of the GAL4 transcription factor, and with a plasmid expressing CCN3 fused to the DNA binding domain of GAL4. Screening of the recombinant clones selected on the basis of leucine, histidine, and tryptophan prototrophy was performed with a β-galactosidase assay. After the interaction between CCN3 and its putative partners was checked with a GST (glutathione S-transferase) pull down assay, the positive clones were identified by cloning. To establish whether the CCN3 protein affected calcium ion flux, a dynamic imaging microscopy system was used, which allowed the fluorometric measurement of the intracellular calcium concentration. The proteins used in the assays were GST fused with either CCN3 or CCN2 (CTGF) and GST alone as a control.
Results: The two hybrid system identified the S100A4 (mts1) calcium binding protein as a partner of CCN3 and the use of the GST fusion proteins showed that the addition of CCN3 and CCN2 to G59 glioblastoma and SK-N-SH neuroblastoma cells caused a pronounced but transient increase of intracellular calcium, originating from both the entry of extracellular calcium and the mobilisation of intracellular stores.
Conclusions: The interaction of CCN3 with S100A4 may account, in part, for the association of CCN3 with carcinogenesis and its pattern of expression in normal conditions. The increased intracellular calcium concentrations induced by CCN3 and CCN2 both involve different processes, among which voltage independent calcium channels might be of considerable importance in regulating the calcium flux associated with cell growth control, motility, and spreading. These observations assign for the first time a biological function to the CCN3 protein and point out a broader role for the CCN proteins in calcium ion signalling.
- CCN3 family of genes
- NOVH
- connective tissue growth factor
- S100A4
- calcium signalling
- calcium channels
- store operated channels
- CTGF, connective tissue growth factor
- DTT, dithiothreitol
- EGF, epidermal growth factor
- GST, glutathione S-transferase
- IP3, inositol 1,4,5-triphosphate
- MAV, myeloblastosis associated virus
- NOV, nephroblastoma overexpressed
- PAGE, polyacrylamide gel electrophoresis
- PBS, phosphate buffered saline
- PBSc, calcified phosphate buffered saline
- PCR, polymerase chain reaction
- PMSF, phenylmethylsulfonyl fluoride
- SDS, sodium dodecyl sulfate
- WISP, wint induced secreted proteins
Statistics from Altmetric.com
- CCN3 family of genes
- NOVH
- connective tissue growth factor
- S100A4
- calcium signalling
- calcium channels
- store operated channels
- CTGF, connective tissue growth factor
- DTT, dithiothreitol
- EGF, epidermal growth factor
- GST, glutathione S-transferase
- IP3, inositol 1,4,5-triphosphate
- MAV, myeloblastosis associated virus
- NOV, nephroblastoma overexpressed
- PAGE, polyacrylamide gel electrophoresis
- PBS, phosphate buffered saline
- PBSc, calcified phosphate buffered saline
- PCR, polymerase chain reaction
- PMSF, phenylmethylsulfonyl fluoride
- SDS, sodium dodecyl sulfate
- WISP, wint induced secreted proteins
The CCN3 (NOV) protein is a member of the CCN (CYR61 (cysteine rich), CTGF (connective tissue growth factor), and NOV (nephroblastoma overexpressed)) family of regulatory proteins.1–4 With ELM1, rCOP1, and WISP (wint induced secreted proteins)5–7 the CCN family now consists of six members. The ccn3 gene was originally described as a target for MAV (myeloblastosis associated virus) in avian nephroblastomas,8 which represent a unique model of the Wilms’s tumour.9 Although its expression was found to be greater in all avian tumours than in normal kidneys, ccn3 was only disrupted in one nephroblastoma and insertional activation of MAV in the vicinity of ccn3 is not a common theme in nephroblastoma (CL Li et al, unpublished data, 2002).
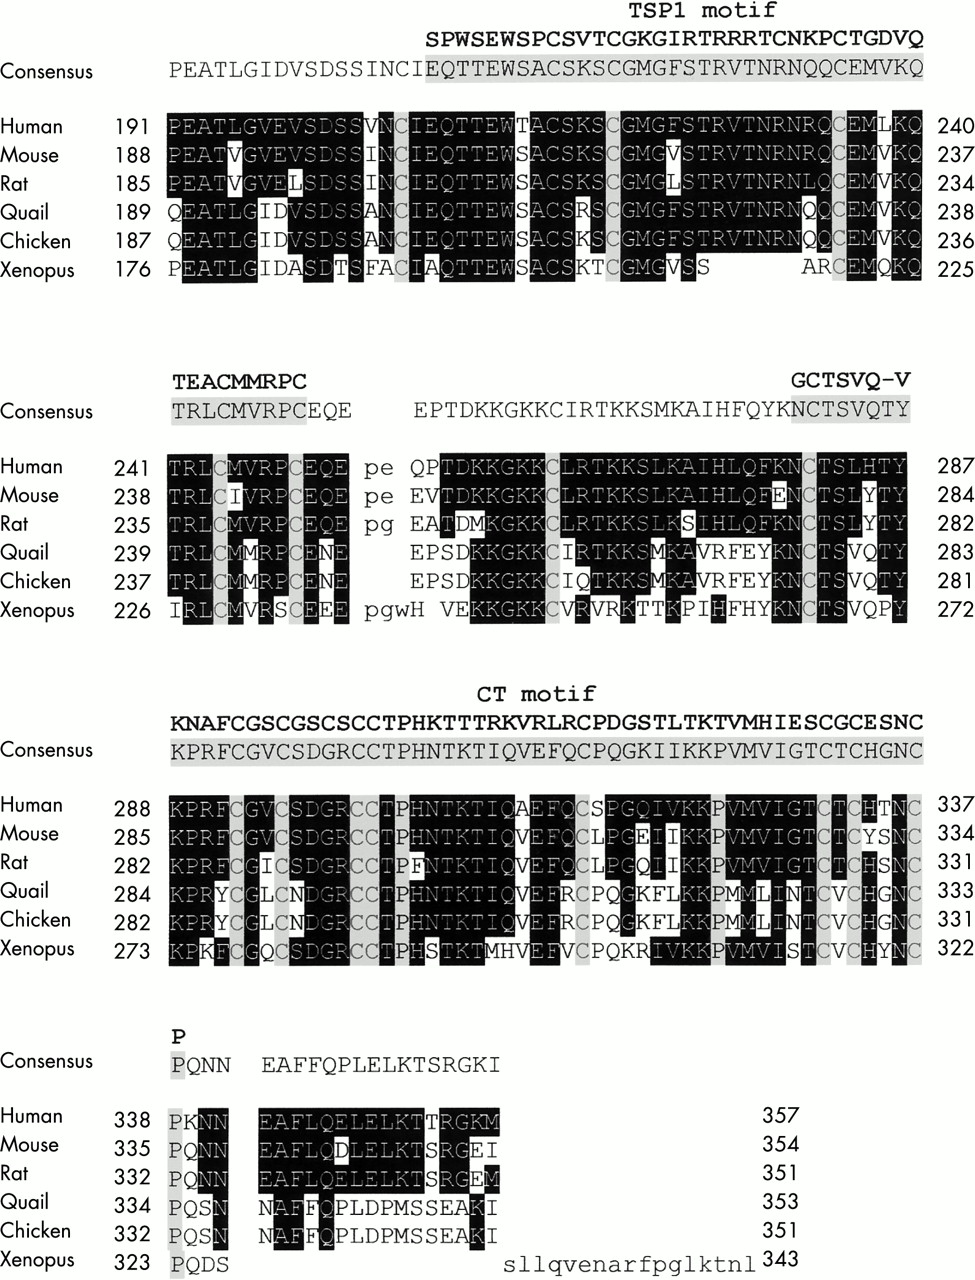
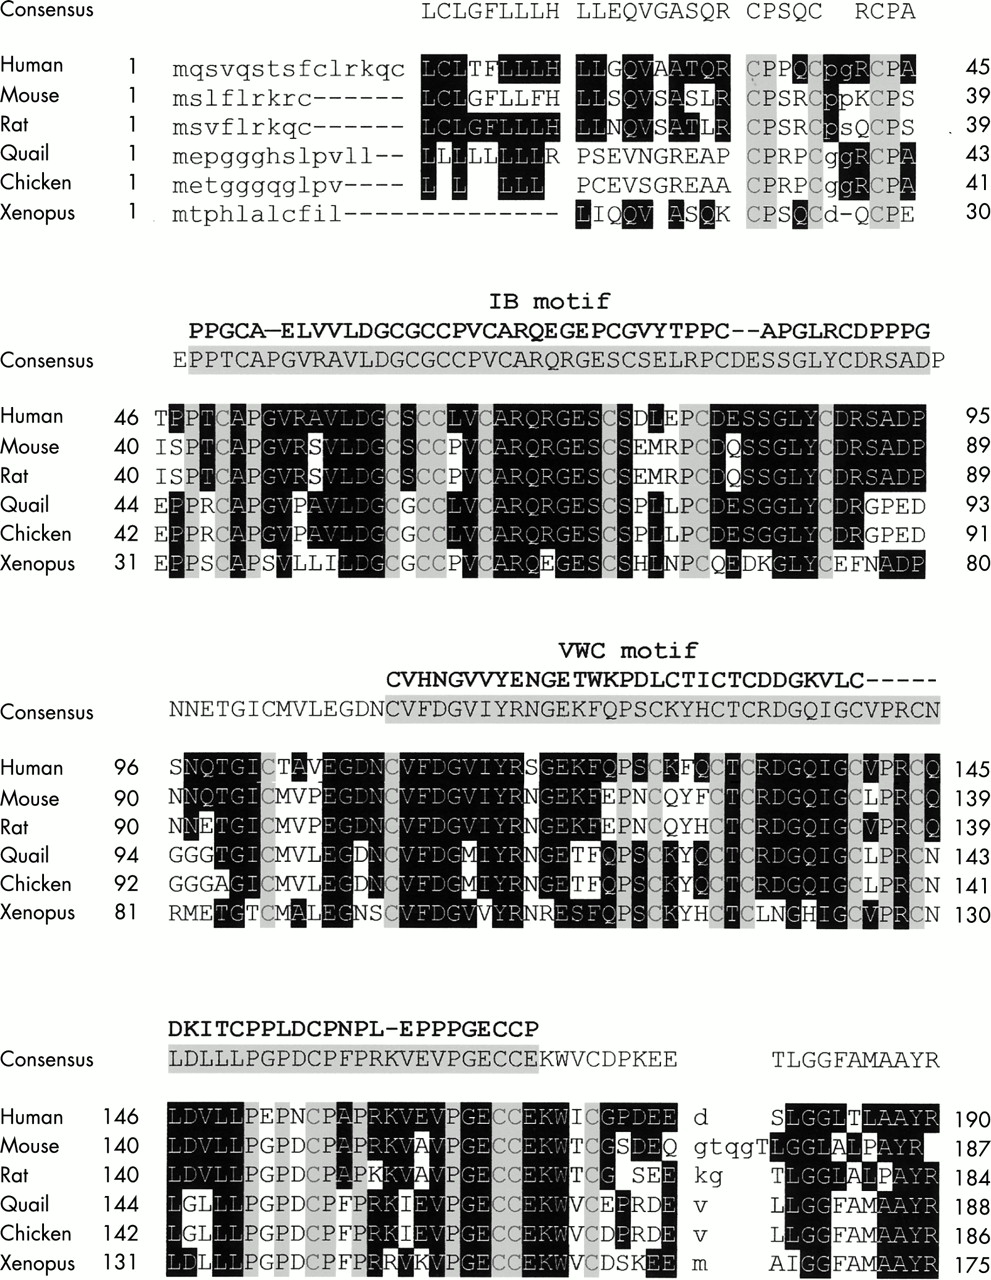
Similar to other members of the CCN family, the CCN3 protein shows some striking features. It is composed of five distinct structural modules encoded by separate exons and contains a total of 38 cysteine residues, the position of which in the four modules has been conserved both throughout evolution and among the different members of the CCN family.10 The structural conservation of CCN3 in the different species in which it has been identified suggests that this protein fulfills important function(s) that are dictated by a common spatial organisation. It is noteworthy that in the first two modules of CCN3, a total of 11 proline residues are found at the same position in species as far apart as xenopus and humans (fig 1). The signal peptide at the N-terminus of the CCN proteins is responsible for the secretion of the full length CCN3 protein, which can be released into the extracellular matrix or remain at the cell membrane.11,12 There are increasing numbers of reports of the existence of CCN isoforms lacking one or two of the basic modules. The N-truncation of CCN3 resulting from MAV insertion in target cell DNA conferred on the CCN3 deprived of signal peptide and module 1 (IB; sharing partial identity with insulin-like growth factor binding proteins) a transforming potential,8 and high concentrations of an N-truncated CCN3 isoform, deprived of modules 1 and 2 (VWC; sharing identity with the type C repeat of Von Willebrand factor), are detected in the nucleus of cancer cells.13 Module 4 (CT; sharing identity with growth factors) is not present in CCN5 (rCOP/WISP2 and CTGFL),5–7,14 and module 2 is absent in WISP1v, a short version of CCN4 (WISP1) expressed in gastric carcinoma.15 These observations raise interesting questions as to the biological functions of these different isoforms and the mechanisms by which they are generated.

Part 1: Amino acid sequence alignment in CCN3 proteins. The amino acid sequence of CCN3 proteins from different species has been aligned with the interalign program (University of Sandford, USA). Those residues whose position is conserved throughout evolution are shaded in black. The 38 conserved cysteine residues and conserved prolines are shaded in grey. The position and sequences of the TSP1 (thrombospondin type 1 repeat) and CT (cystin knot) motifs have been indicated in bold above the CCN3 consensus sequences for each domain.

Part 2: Amino acid sequence alignment in CCN3 proteins. The amino acid sequence of CCN3 proteins from different species has been aligned with the interalign program (University of Sandford, USA). Those residues whose position is conserved throughout evolution are shaded in black. The 38 conserved cysteine residues and conserved prolines are shaded in grey. The position and sequences of the IB (insulin-like growth factor binding related proteins) and VWC (von willebrand type C repeat) motifs have been indicated in bold above the CCN3 consensus sequences for each domain.
The ccn3 gene spans approximately 7.5 kb of DNA (fig 2) and maps to human chromosome 8q24.16 Its expression in normal conditions is under tight spatial and temporal regulation. In humans, rodents, and birds the expression of ccn3 during normal development has been associated with the polarised differentiation of different cell types in various systems, including cartilage and bone, central nervous system, kidney, striated muscle, and cardiac muscle.4,17–20 The major sites of ccn3 expression in humans, rodents, and chickens were identified by in situ hybridisation and immunocytochemistry as the zona fasciculata of the adrenal, neurones and astrocytes in the nervous system, ganglia, and fusing muscle cells.4,17–20 In pathological conditions, the expression of both human ccn3 mRNA species and CCN3 protein is impaired in many different types of tumours (see Perbal4 for a review). In neuroblastomas (B Perbal et al, unpublished data, 1997), Wilms’s tumours,17 osteosarcomas, and chondroblastomas,21,22 the expression of ccn3 was a marker of differentiation, whereas in renal cell carcinomas,23 prostate carcinomas,24 and Ewing’s tumours,21 the expression of ccn3 was associated with increased cellular proliferation. We have recently reported that CCN3 has antiproliferative activity in glioblastomas and that its expression in Ewing’s sarcoma is associated with a greater risk of developing metastasis.21,25
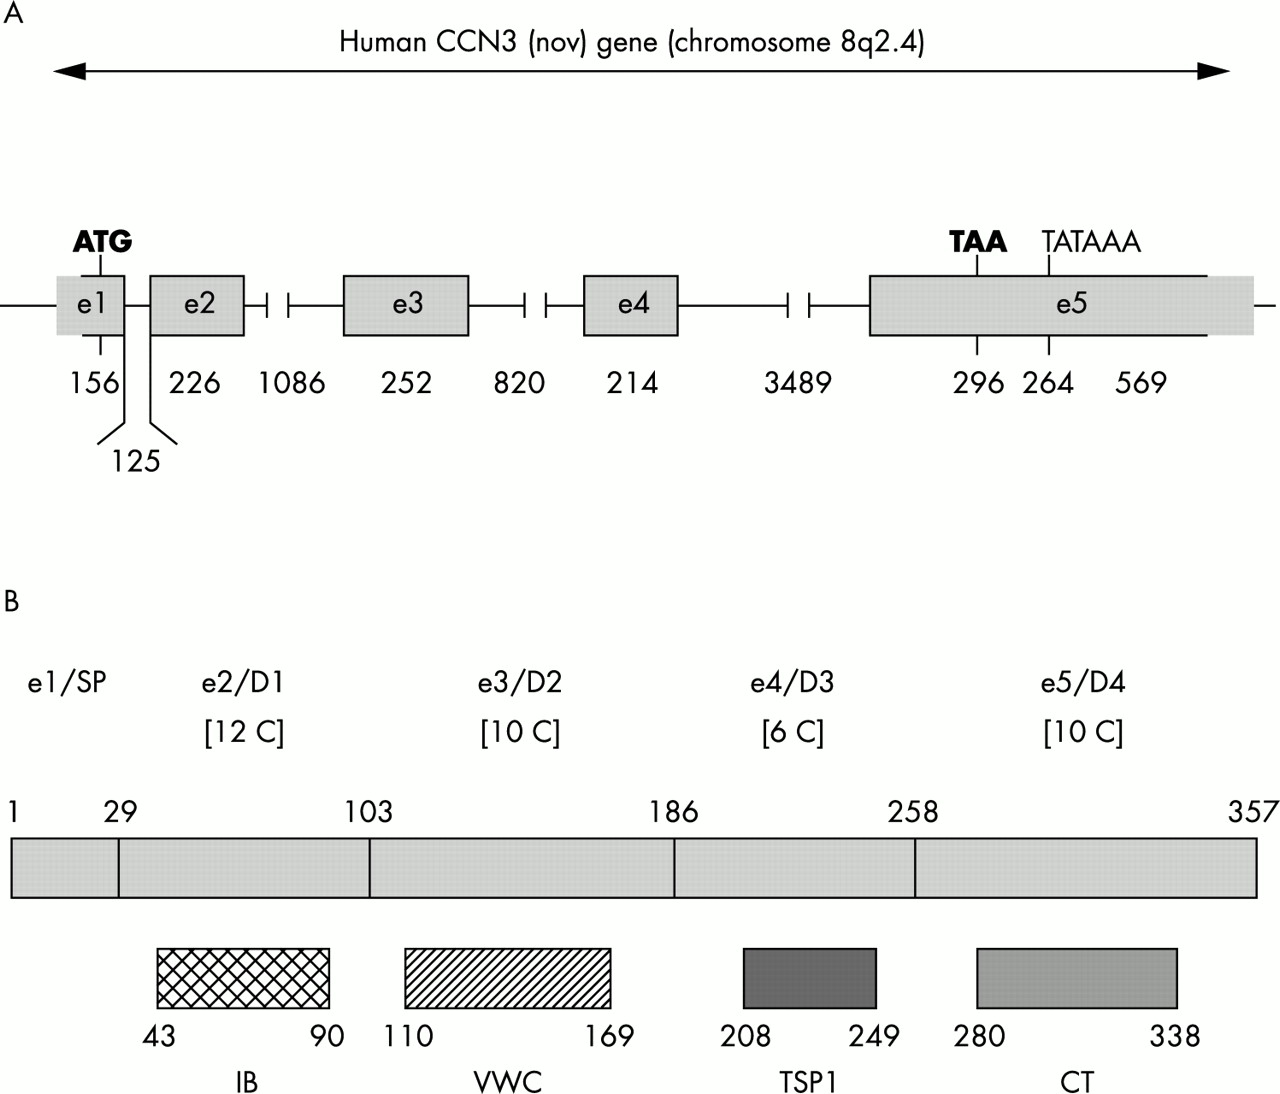
Distribution of sequences encoding the ccn3 gene and multimodular organisation of the CCN3 protein. (A) Schematic representation of the exon distribution in the human ccn3 gene. The sizes are given in base pairs. Boxed sequences are present in the human ccn3 cDNA clone used in previous studies (see Perbal4 for review). (B) Schematic representation of the five structural modules of the CCN3 protein. The signal peptide (SP) is encoded by exon 1 (e1) and the domains 1–4 (D1–4) are encoded by exons 2–5 (e2–5). The length of each domain is indicated in amino acid residues. The number of cysteine residues present in each domain is shown in square brackets. The positions of amino acid sequence motifs sharing identity with insulin-like growth factor binding related proteins (IB), von Willebrand type C repeat (VWC), thrombospondin type 1 repeat (TSP1), and cystin knot (CT) are indicated below each module. The consensus sequence for each motif is indicated in fig 1.
The variety of expression sites and activities attributed to the CCN proteins has led to the proposal4 that the different biological properties of the CCN proteins result from combinatorial events and depend upon their association with multiple partners, the bioavailability of which may vary greatly from one site to the other.
“Our observations raise the possibility that CCN3 may be interacting with a broad range of proteins containing epidermal growth factor-like repeats, the functions of which have been reported to be dependent upon calcium fixation”
We have reported previously that the secreted CCN3 protein interacts with fibulin 1C and that the nuclear CCN3 isoform interacts with the rpb7 subunit of RNA polymerase II.13,26 More recently, we have also shown that CCN3 interacts with the NOTCH1 protein.26a We established that the interaction of CCN3 with both fibulin 1C and NOTCH1 occurred at the level of epidermal growth factor (EGF)-like repeats, which are thought to participate in the regulation of matrix and soluble protein interactions. Our observations raise the possibility that CCN3 may be interacting with a broad range of proteins containing EGF-like repeats, the functions of which have been reported to be dependent upon calcium fixation.
Here, we report that CCN3 physically interacts with the calcium binding protein S100A4 and induces a significant transient increase of intracellular calcium in glioblastoma and nervous system cells, suggesting that CCN3 might play a pivotal role in calcium dependent signalling.
MATERIALS AND METHODS
Molecular cloning
The general procedures for molecular cloning were as described previously.27 The ccn3 coding sequence was amplified by using the NH2-5 and NH5-3 primers and cloned in frame with the glutathione S-transferase (GST) gene at the EcoR1 and SalI sites of the pGEX4T1 vector (Amersham/Pharmacia). Sequencing of the resulting clone (GSTNH25) was performed to confirm that it encoded a full length native NOV protein fused to the GST moiety from the pGEX vector.
To construct PGEX–CTGF, the PGEX4T1 vector previously digested with BamH1 and SalI was first ligated with a mixture of PGEXN5 and PGEXN3 primers (boiled for 10 minutes and chilled in a heating block to 25°C) in the presence of T4 DNA ligase. This step resulted in the destruction of the original pGEX BamHI site and the introduction of new NcoI and BamHI sites. The NcoI site allowed in frame insertion of the CTGF coding sequence contained in the NcoI-BamHI CTGF DNA fragment from pACT2–CTGF.26
The preparation of recombinant DNA was performed with Qiagen kits. After performing the optional washing of the columns, the recombinant plasmid DNA from the minipreparations was usually eluted with 50 μl of sterile distilled water. For midipreparations, the final DNA pellet was resuspended in 300 μl of sterile distilled water.
Electrocompetent cells were prepared by seeding one litre of LB medium with 10 ml of an overnight culture of the appropriate bacterial strain. The cells were grown with shaking at 250 rpm at 37°C until the culture reached an optical density of 0.7 and they were then collected by centrifugation at 4000 ×g in a prechilled GS3 Sorvall rotor for 15 minutes. The bacterial pellet was resuspended in one litre of ice cold sterile 10% glycerol and the suspension was centrifuged at 4000 ×g in the GS3 Sorvall rotor for 15 minutes at 4°C. The pellet was then resuspended in 0.5 litre of ice cold sterile 10% glycerol and centrifuged again at 4000 ×g for 15 minutes at 4°C. The pellet was resuspended in 20 ml of ice cold sterile 10% glycerol, and centrifuged again. The final pellet was resuspended in 2 ml of ice cold sterile 10% glycerol and the resulting preparation of electrocompetent cells was distributed in 100 μl aliquots and frozen at −80°C. The competence of the bacterial preparations was checked by performing a transformation (see below) and counting the colonies obtained with a known amount of pUC18 DNA.
Bacterial strains
For the expression of the GST fusion proteins, BL21 bacteria (Escherichia coli BF− ompT hsdS(rB− mB−) dcm+ Tetr gal (DE3) endA Hte) were used. HB101 bacteria (F− supE44 ara14 galK2 lacY1 leuB6 thi-1 Δ(gpt-proA)62 rpsL20 (Strr) xyl-5 mtl-1 recA13 Δ(mcrC-mrr) HsdS 20 (r− m−)) were used to recover, from transformed yeast, the plasmid DNA encoding the GAL4TA domain fused to the target protein selected in the two hybrid screening. The cloning and amplification of the other plasmids were performed in DH5α (F’phi80dlacZ delta(lacZYA–argF)U169 deoR recA1 endA1 hsdR17 (rk−, m k+) phoA supE44 lambda-thi-1 gyrA96 relA1/F’ proAB+ lacIqZdeltaM15 Tn10(tetr)).
Transformation
The ligation of vectors and inserts to be cloned was usually performed for 18 hours at 12°C in 50 μl reaction samples containing 10nM ends of each DNA fragment and 1 μl of a high concentration T4 DNA ligase (New England Biolabs, Beverley, Massachusetts, USA; 400 U/μl). For transformation, ligation mixtures were mixed with 0.5 ml of electrocompetent cells in electroporation cuvettes (Biorad, Marnes La Coquette, France) on ice. Electroporation was performed with Biorad Gene pulser (capacitance, 25 μF; resistance, 300 Ohms; at 1.8 KV). Electroporated bacteria were resuspended in 1 ml of chilled LB medium, incubated for one hour with agitation (250 rpm) at 37°C, and spread on to 12% agar plates containing 100 μg/ml ampicillin.
Two hybrid system screening
Conditions for screening the two hybrid system libraries have been described previously.13,26 Positive clones were restreaked twice on selective medium deprived of histidine and containing 25mM 3-amino-1,2,3,4 triazole (3AT), before checking interactions with the β-galactosidase assay. Recombinant plasmids encoding the proteins interacting with CCN3 were purified from 4 ml of yeast grown overnight in minimal medium. Cells were centrifuged in microcentrifuge tubes and resuspended in 100 μl of lysis buffer (2% Triton X100, 1% sodium dodecyl sulfate (SDS), 100mM NaCl, 10mM Tris/HCl, pH 8.0, 1mM EDTA, pH 7.5), 100 μl of sterile glass beads, and 100 μl of a phenol/chloroform/isoamyl alcohol mixture (49.5/49.5/1). After two minutes of vortexing, the mixture was centrifuged for 20 minutes at 25°C and the upper phase used as a source of DNA. For sequencing, the plasmid DNA was purified on Quiaquick columns. Plasmid DNA was usually recovered by transforming competent HB101 bacteria and selecting transformants on a minimum medium deprived of leucine and containing ampicillin.
Production and purification of GST fusion proteins
A 20 ml sample of an overnight culture of recombinant bacteria grown in LB culture medium containing 100 μg/ml ampicillin was used to seed one litre of ampicillin LB medium. The culture was incubated at 37°C with agitation at 250 rpm until an optical density of 0.6 was reached. At that time, IPTG was added to a final concentration of 0.1mM to induce the production of the GST fusion protein, for 90 minutes at 37°C with agitation. Bacteria were collected after 10 minutes of centrifugation at 4000 ×g in a Sorvall GSA rotor at 4°C and resuspended in 50 ml lysis buffer (10mM Tris/HCl, pH 7.5, 100mM KCl, 1mM EDTA, 5mM dithiothreitol (DTT), and 0.5% NP40), containing 100mM phenylmethylsulfonyl fluoride (PMSF), 10mM TPCK (N-tosyl-L-phenylalanine chloromethyl ketone), and 10mM TLCK (N-α-p-tosyl-L-lysine chloromethyl ketone) . After adding 5 ml of lysozyme solution (10 mg/ml in 25mM Tris/HCl, pH 8.0) the mixture was sonicated until the cells were completely broken and centrifuged for 20 minutes at 5800 ×g in a Sorvall SS34 rotor to eliminate the cell debris. Each of the two 25 ml fractions of supernatant was mixed with 1.5 ml of GST sepharose beads (50% slurry in phosphate buffered saline (PBS)), and incubated for one hour at 4°C on a rotating wheel.
The GST beads were centrifuged at low speed in a table top centrifuge and washed five times with 6 ml binding buffer (20mM Tris/HCl, pH 7.5, 100mM KCl, 2mM CaCl2, 2mM MgCl2, 5mM DTT, and 0.5% NP40), containing 100mM PMSF, 10mM TPCK, and 10mM TLCK. Elution of the GST fusion protein was performed by resuspension in 3 ml elution buffer (10mM reduced glutathione in 50mM Tris/HCl, pH 8.0). After one hour of agitation on a rotary wheel at 4°C, the mixture was resuspended and the supernatant was collected. The elution was repeated four times and the different fractions kept separately. The quantity of the fusion protein recovered was estimated by staining and comparison with a bovine serum albumin calibrated standard after electrophoresis on a denaturing 12% polyacrylamide gel.
The protein fractions were lyophilised and kept at −80°C. Before use, the lyophilised fractions were resuspended in PBS, pH 7.5, and dialysed against the same buffer.
Control GST protein expressed by the PGEX4T1 vector alone was produced, purified, stored, and used under the same conditions.
SDS polyacrylamide gel electrophoresis (SDS-PAGE)
Polyacrylamide gel electrophoresis was performed as described previously,27 except that N,N`-diallyltartardiamide (DATD; Biorad) was used instead of bisacrylamide to prepare both the separation and stacking gels.
Primers
-
T7AD: 5`-TAA TAC GAC TCA CTA TAG GGA GAC CAC CAC ATG GAT GAT GTA TAT AAC TAT CTA TTC-3`
-
4ADREV2: 5`-CAG TGA GCG CGC GTA ATA CGA CTC ACT ATA-3`
-
NH2–5: 5`-TATT GAA TTC GTC GCT GCG ACT CAG CGC TGC-3`
-
NH5–3: 5`-CTGC GTC GAC TTA CAT TTT CCC TCT GGT AGT-3`
-
PGEXN5: 5`-GA TCT GGC TCT TCC AAC GAA TTC ACC ATG GGC CCG GAT CCG-3`
-
PGEXN3: 5`-TC GAC GGA TCC GGG CCC ATG GTG AAT TCG TTG GAA GAG CCA-3`
After synthesis, the oligonucleotides were deprotected by overnight incubation at 55°C, dried in 100 μl fractions with a speedvac with heating, and resuspended in 100 μl of TE (10mM Tris/HCl, pH 8.0, 1mM EDTA) before loading on to 1 ml sephadex G25 columns previously prepared in disposable plastic syringes. The flow through contained the purified oligonucleotides.
Polymerase chain reaction (PCR)
For amplification of DNA fragments, 0.5 μl of the DNA template (plasmid minipreparation DNA) was mixed with 1 μl of both the 5` and the 3` specific primers, 2.5 μl of 10mM dNTPs, 5 μl of 25mM MgCl2, 10 μl of 10× Taq buffer, 5 μl of DMSO, 74 μl of Taq polymerase, and 74 μl of sterile distilled water. PCR was performed for 35 cycles (each cycle being 95°C for two minutes, 50°C for three minutes, and 72°C for three minutes). The PCR products were run on a 1.2% agarose gel in Tris acetate EDTA (TAE) buffer and eluted with the Qiagen PCR purification kit, under conditions recommended by the supplier.
The templates for in vitro transcription/translation were prepared as follows: 0.5 μl of each minipreparation DNA plasmid was mixed with 10 μl buffer, 4.8 μl MgCl2, 10 μl DMSO, and 62.2 μl water, as described above. The mixture was boiled for five minutes and chilled on ice before the addition of 7.5 μl of water, 2.0 μl of 10mM dNTPs, and 0.5 μl of Taq polymerase. The preparations were then incubated for 35 cycles at 95°C for one minute, 60°C for one minute, and 72°C for one minute.
In vitro transcription/translation
The in vitro transcription/translation of PCR amplified templates was performed with the TNT lysate reaction mix (Promega, Charbonniéres, France), as recommended by the supplier, with the following modifications: PCR products were extracted once with 200 μl of a 24/1 mixture of chloroform and isoamyl alcohol, and precipitated by the addition of 15 μl 3M sodium acetate and 500 μl of pre-chilled (−20°C) absolute ethanol. After 10 minutes of incubation in a dry ice/ethanol bath, the DNA precipitate was collected by a 10 minute centrifugation at 12 000 ×g in a microcentrifuge, washed once with 70% chilled ethanol, and dried by speedvac centrifugation at medium temperature. The DNA precipitate was resuspended in 6 μl of sterile distilled water and mixed with 25 μl of the TNT reticulocyte extract, 2 μl of the TNT reaction buffer, 1 μl of T7 RNA polymerase, 1 μl of 1mM amino acid mixture deprived of methionine, 1 μl of RNAsin ribonuclease inhibitor, and 4 μl of [35S] methionine (37 TBq/mmol, 10 mCi/ml). The mixture was incubated for 1.5 hours at 30°C; the in vitro proteins were analysed by electrophoresis on a 15% polyacrylamide gel and visualised by autoradiography.
Sequencing
DNA sequencing was performed routinely at Genomex (Grenoble, France).
GST pull down
Samples of [35S] labelled protein from in vitro transcription/translation (20 μl) were incubated for 18 hours at 4°C on a rotating wheel with 5 μl of GST–CCN3 Sepharose beads in a total reaction volume of 100 μl of binding buffer (20mM Tris/HCl, pH 7.5, 100mM KCl, 2mM CaCl2, 2mM MgCl2, 5mM DTT, 0.5% NP40, 5% glycerol, 100mM PMSF, 10mM TPCK, and 10mM TLCK). After incubation, the GST sepharose beads were washed five times with 2 ml of chilled PBS and the protein complexes bound to the beads were analysed by electrophoresis on a 15% polyacrylamide gel and visualised by autoradiography.
Cell culture
The glioblastoma G59 cells have been described previously.28 The SK-N-SH cells are neuroblastoma derived cells. Cells were grown in a 5% CO2 atmosphere at 37°C in DMEM supplemented with 10% serum (for G59) or 5% serum (for SK-N-SH), 2mM glutamate, 200 μg/ml penicillin, and 100 μg/ml streptomycin sulfate.
Intracellular calcium measurement
The transient increase of intracellular calcium concentration was measured in response to activation of SK-N-SH and G59 cells using a dynamic imaging microscopy system QuantiCell 700 (VisiTech international Ltd, Sunderland, UK) with 15–20 cells in each field, as described previously.29,30 Cells were grown on glass coverslips (22 mm) for four days. They were then loaded with 4mM Fura-2 AM (Molecular Probes, Interbiotech, France) in PBS supplemented with 1.3mM CaCl2, 0.8mM MgCl2, 5mM glucose, and 20mM Hepes/Tris (PBSc), pH 7.4 at 37°C for one hour. After washing with PBSc and background recording for 40 seconds (20 images), the cells were treated with GST–NH25 or GST alone as control. Fluorescent images were recorded every two seconds and the intracellular calcium concentration was calculated from the ratio of the fluorescence intensities at 340 and 380 nm on a pixel basis. The dose–response curve for intracellular calcium concentrations was obtained by integrating the area under the curve (measuring calcium transients plotted as a function of time for each field from the addition of the GST–NH25 until the end of image recording, 200 seconds) and averaging the fluorescence from the whole field of cells chosen.31 The calcium stimulation curves were determined for each tested concentration of GST–NH25.
RESULTS
CCN3 physically interacts with S100A4 calcium binding protein
A HeLa cell cDNA library fused with sequences encoding the yeast GAL4 transcriptional activation domain in the pGADGH vector was used to screen for proteins interacting with CCN3. The CCN3 pGBT9 derived bait plasmid was obtained after fusing the CCN3 sequences encoding domains 2–4 (fig 1) in frame with the DNA binding domain of GAL4.13,26 The rationale for using the coding sequence CCN3 of the full length secreted CCN3 protein was based on the assumption that specific interactions might involve structural motifs resulting from the tertiary structure of the CCN3 protein and from the physical interaction of different domains. The screening was performed as described in the materials and methods section and several clones encoding proteins interacting with CCN3 were isolated. To check that candidate clones encoded proteins that could physically interact with CCN3 outside of the yeast nucleus, the plasmids encoding the potential targets were purified after transformation of HB101 bacteria and PCR amplified before being used for in vitro transcription/translation (see materials and methods). The [35S] labelled proteins synthesised from the PCR amplified templates were used to run GST pull down assays. In many cases, binding of in vitro labelled proteins to GST–CCN3 sepharose beads took place as shown by SDS-PAGE. The sequences of the corresponding cloned inserts were established and analysed with the BLAST program from NCBI (National Center for Biotechnology Information; http://www.ncbi.nlm.nih.gov).
Among the different plasmids that encoded potential partners of CCN3, four independent clones shared a high degree of identity with the S100A4 calcium binding protein (also designated p9Ka, calvasculin, CAPL, mts1, pEL98, 18A2, 42A and fsp (see R Barroclough32 for a review)). The longest clone showed 100% identity with S100A4 mRNA over 512 nucleotides. Analysis of the insert sequences indicated that it encoded the full length (101 amino acid residues) S100A4 protein (fig 3). Interestingly, the 5` non-coding sequences found upstream of the S100 A4 protein initiation codon were inserted in frame with both the GAL4 transactivation domain of pGAD–GH and S100A4, thereby encoding a stretch of 25 amino acid residues inserted between the two fused proteins. The 5` proximal sequences of the S100A4 insert corresponded to an alternative non-coding exon designated e1b, which was first identified in S100A4 cDNA species isolated from a human osteosarcoma library and reported to be more abundantly expressed in HeLa cells and human adrenal carcinoma cells, and to be predominant in lung carcinoma.
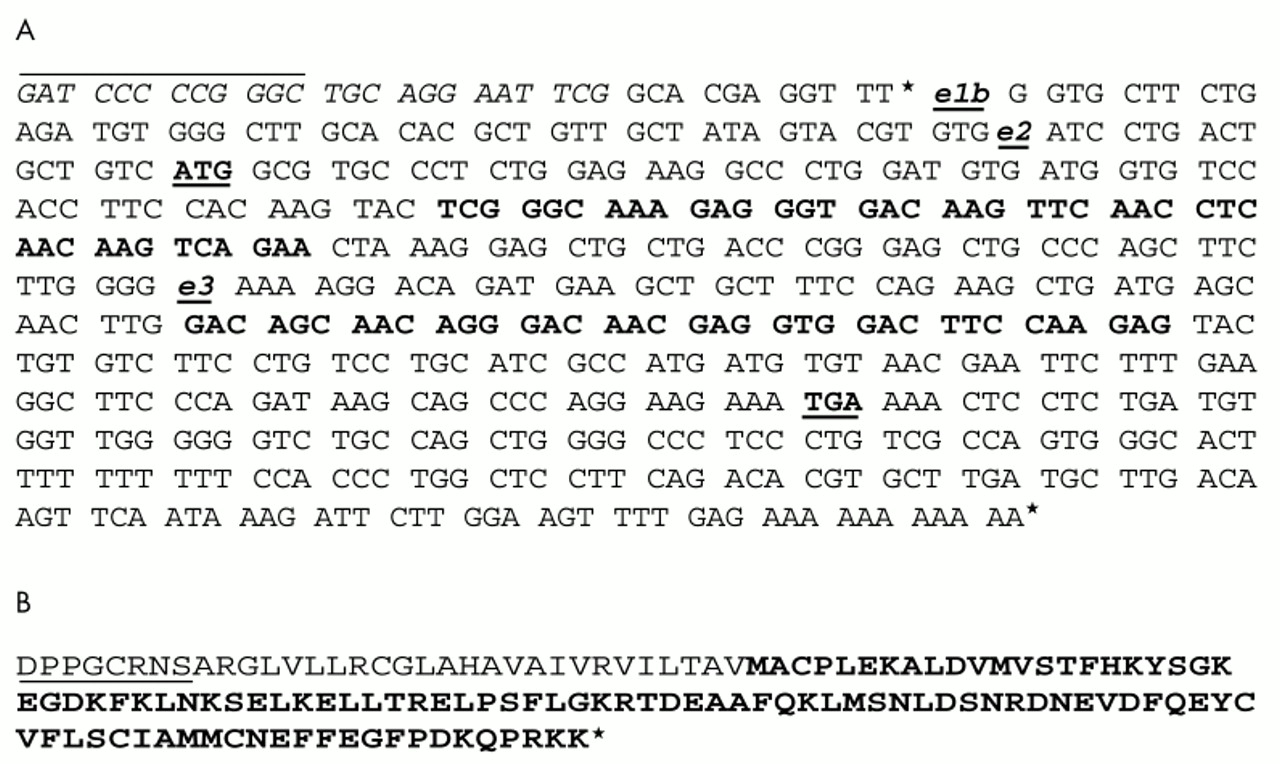
Organisation of the S100A4 sequences in clone CLM. (A) The nucleotide sequence of the GAL4AD-CLM clone at the cloning site and (B) the protein encoded by the GAL4AD-CLM clone at the cloning site. The pGADGH vector sequences are indicated in italics. The HeLa cDNA transcripts were cloned at the EcoRI site. The nucleotide sequence contained between e1b and e2 corresponds to the alternative 5` non-coding sequences characterised in human cells. The S100A4 coding sequences are contained in exons 2 and 3. The two sets of sequences in bold correspond to the calcium binding loops in the S100A4 protein. The first calcium binding site, which is encoded by exon 2, is composed of 14 amino acids with a helix–loop–helix conformation (helix A: VMVSTFHKY; loop 1: SGKEGDKFKLNKSE; helix B: LKELLTR). It corresponds to the binding loop of the pseudo EF hand (from V at position 11 to E at position 41) characteristic of the S100 proteins. The second calcium binding site, encoded by exon 3, is composed of 12 amino acids (helix C: AFQKLMSNL; loop 2: DSNRDNEVDFQE; helix D: YCVFLSC) contained in a canonical EF hand (from F at position 52 to I at position 82).
The interaction of CCN3 with S100A4 raised the possibility that it might also be involved at some stage of calcium signalling, and led us to check whether CCN3 itself might exhibit any effect on the intracellular calcium concentration.
Induction of intracellular calcium waves by CCN3
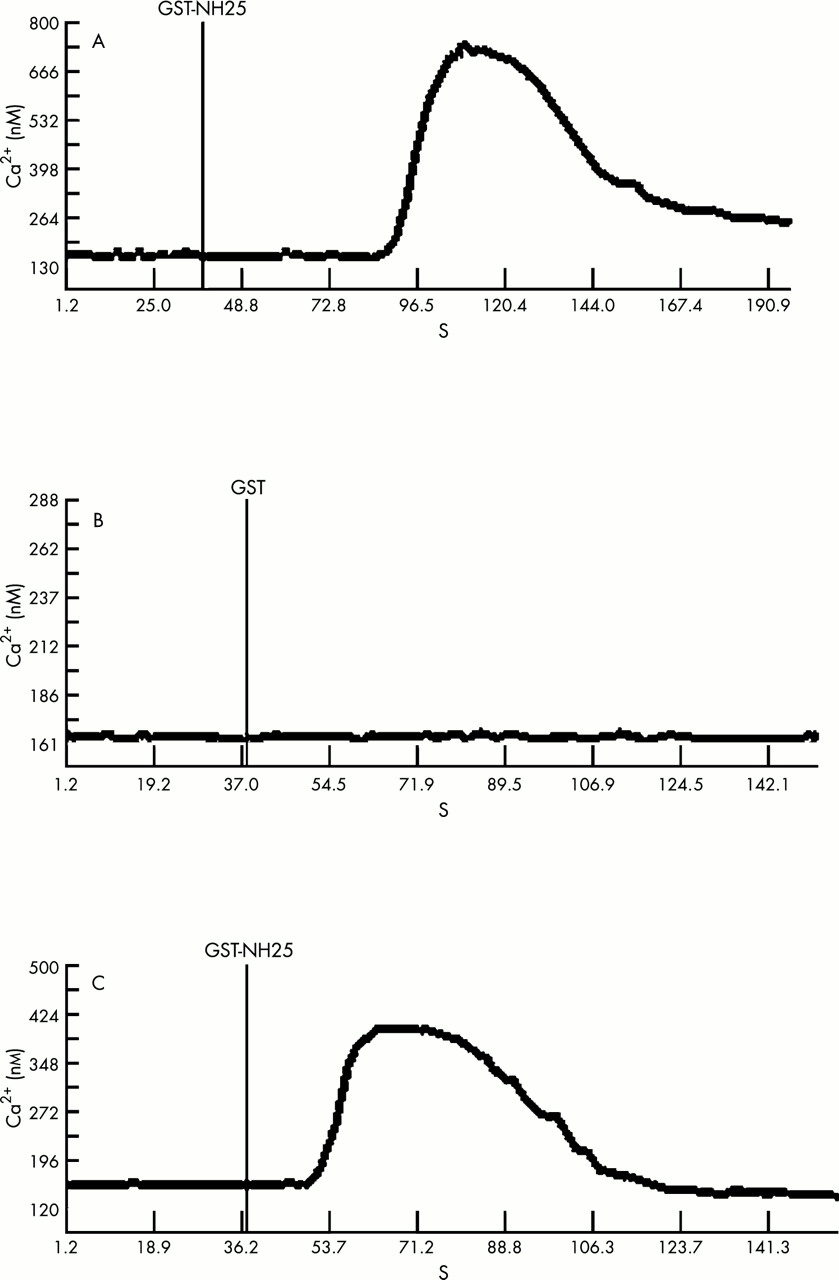
The application of GST–NH25 resulted in a transient increase of the intracellular calcium concentration in G59 glioblastoma cells (fig 4A). When the control GST protein alone was applied, there was no effect on the concentration of intracellular calcium (fig 4B). A similar transient increase in calcium was also seen with human neuroblastoma SK-N-SH cells upon GST–NH25 delivery (fig 4C).

Effect of GST–NH25 on intracellular calcium increase in G59 and SK-N-SH cells. (A) The GST–NH25 protein (1 μg/ml) was added to G59 cells after 40 seconds of background recording. (B) GST only (5 μg/ml) was tested as control on G59 cells. (C) Under the same conditions, GST–NH25 (2 μg/ml) was applied to SK-N-SH cells.
Furthermore, a transient increase in intracellular calcium was also induced when GST–CCN2 was applied to G59 cells (data not shown). No increase was induced by the GST–fibulin C fusion protein, which contained the portion of fibulin C interacting with CCN3.26
The calcium response was dependent upon GST–NH25 concentrations. The amplitude of the transient calcium waves increased with the amount of GST–NH25 added, reaching a maximum at 10 μg/ml of GST–NH25 fusion protein. Toxic effects (including the cells blowing up) were seen when higher concentrations of the GST fusion protein were used. The dose–response curves presented in fig 5 gave IC50 values of 1.3 and 2.4 μg/ml of GST–NH25 in G59 and SK-N-SH cells, respectively.
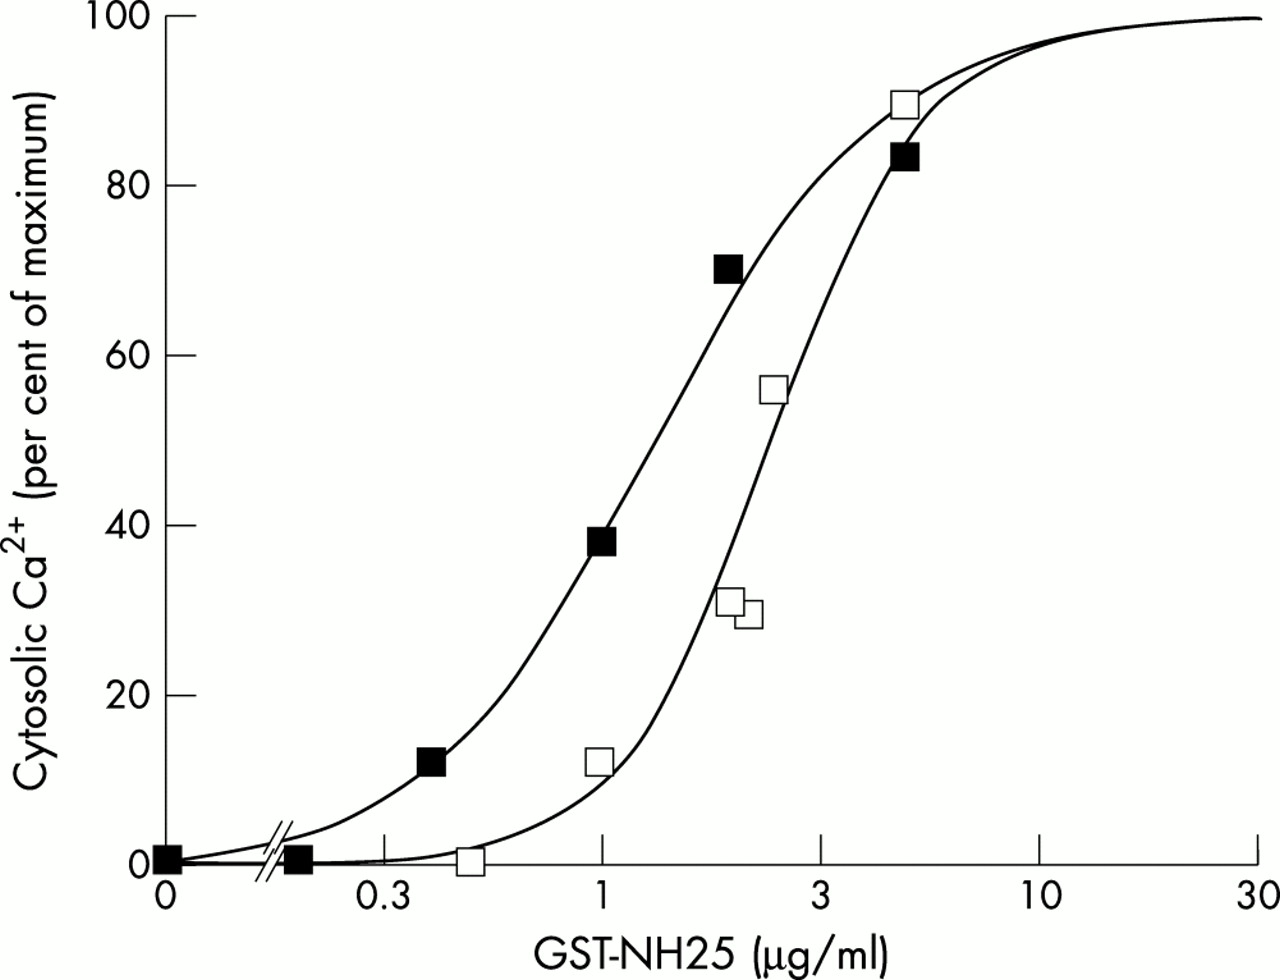
Intracellular calcium mobilisation induced by increasing concentrations of GST–NH25. Neuroblastoma SK-N-SH (open squares) or glioblastoma G59 (closed squares) cells were treated with increasing concentrations of GST–NH25 protein. The intracellular calcium influx was determined for each concentration, and represented as the percentage of the maximal activation. All other details are as described under the materials and methods section.
To determine the origin of this transient calcium increase, several calcium blockers were tested (fig 6) on both SK-N-SH (fig 6A–D) and G59 (fig 6A’–D’) cell lines. The intracellular calcium concentration increased after the addition of 2 μg/ml of GST–NH25 (GN) to SK-N-SH cells (fig 6A), but this increase was totally inhibited in a calcium depleted medium (20mM EGTA) (fig 6B). Conversely, under the same conditions, GST–NH25 induced a transient calcium increase in G59 cells, even in the absence of extracellular calcium (fig 6B’).

Effects of calcium blockers on intracellular calcium mobilisation induced by GST–NH25 in (A–D) SK-N-SH and (A’–D’) G59 cells. GST–NH25 (2 μg/ml) was applied in (A,A’) the absence or the presence of (B,B’) 20mM EGTA, (C,C’) 1μM verapamil, or (D,D’) 10μM flunarizine.
Furthermore, the addition of CaCl2 to EGTA containing medium induced a sustained increase of intracellular calcium, suggesting a mixed interaction of CCN3 with the stimulation and release of intracellular calcium from the internal store and with the entry of extracellular calcium in G59 cells.
The addition of verapamil (1μM; fig 6C,C’), a blocker of voltage dependant calcium channels,33 or the addition of flunarizine (10μM; fig 6D,D’), a blocker of voltage dependant sodium and calcium channels,33 did not modify the transient calcium increase induced by GST–NH25 in the two types of cell line.
DISCUSSION
It is now well established that cytoplasmic calcium is a key messenger that regulates many different biological functions, including cellular communication, proliferation, and differentiation. Concentrations of intracellular calcium are tightly controlled by processes involving both uptake from exogenous sources and the mobilisation of intracellular stores associated with the endoplasmic reticulum network. The entry of calcium into cells is controlled by a complex set of channels that can open either upon binding of an external signalling ligand (voltage and receptor operated channels) or as a result of calcium depletion of internal stores (store operated channels). Several classes of cell surface receptor playing key roles in cell–cell and cell–extracellular matrix adhesion have been reported to be calcium binding proteins. For example, several integrins stimulate changes in intracellular calcium concentrations that are associated with the regulation of cell fate and development.34,35
In many cells, biological regulators induce propagating and oscillatory rises in intracellular concentration as a result of calcium release form the endoplasmic reticulum. The spatiotemporal regulation of calcium release involves several channels, of which the inositol 1,4,5-triphosphate (IP3) receptors have been the most extensively studied, along with the ryanodine receptors (RyR) (for recent reviews see Cullen and Lockyer36 and Berridge and colleagues37,38). The flow of calcium into the cytoplasm could be deleterious if intracellular calcium concentrations were not controlled by buffer systems, which regulate the delivery of calcium in the cell. Members of the S100 family of proteins play an important role as calcium sensors and buffers.
It is noteworthy that CCN3 expression is tightly associated with the control of cell proliferation and is detected during development in tissues where calcium metabolism is of prime importance.4 For instance, the pattern of CCN3 expression during chondrogenesis in vivo and in micromass cultures suggested that it was involved in the late phases of the chondrogenesis process, probably at the transition between chondrogenesis and osteogenesis, when there is tight control of calcium metabolism leading to bone mineralisation.4 The adrenal gland, cardiomyocytes, renal tubules, and axons were among other sites of CCN3 expression during normal development in both humans and animals.4 In all cases, calcium metabolism and ion migration are essential for the proper biological functions of the corresponding organs. Therefore, the physical interaction of CCN3 with S100A4 could play a role in the processes, controlling the bioavailability and concentrations of intracellular calcium in these situations.
The S100A4 protein is a 101 amino acid calcium binding protein. It belongs to the S100 (soluble in 100% ammonium sulfate) family of proteins, the first members of which were isolated from bovine brain.39 To date, 16 members sharing various degrees of amino acid sequence identity make up the S100 family of proteins. They contain two calcium binding sites with a helix–loop–helix structure (EF hands). As is the case with other S100 proteins, the N-terminal EF hand site of S100A4 is composed of a 14 residue calcium binding loop with a high number of basic residues, whereas the C-terminal EF hand of S100A4 encompasses a canonical 12 amino acid loop including several acidic residues (fig 2) (see Smith and Shaw40 and Nelson and Chazin41 for reviews). The two EF hand motifs have different affinities for calcium and the S100 proteins are generally thought to modulate the propagation of calcium signals via their ability to bind calcium.
“The physical interaction of CCN3 and S100A4 now extends the range of interactions of the CCN family of cell growth regulators, whose role in controlling fundamental aspects of cell survival and multiplication is becoming increasingly important”
In normal conditions, the expression of S100A4 is rather ubiquitous. It has been detected in a variety of developing mesodermal embryonic tissues during mouse development and was proposed to be involved in mesenchymal–epithelial interactions.42 The S100A4 protein has also been detected in bovine retina,43 human developing and adult central nervous system,44 platelets,45 and heart,46 at sites where CCN3 and other CCN proteins have also been reported to be expressed.
A variety of target proteins, including p53, S100A1, non-muscle tropomyosin, non-muscle myosin heavy chain, F actin, liprin β1, and methionine aminopeptidase 2 were found to interact with S100A4.47–52 Whether the variety of targets is a reflection of different biological properties and modes of action remains unclear.
Take home messages
-
The S100A4 calcium binding protein was identified as a partner of CCN3, which may partly explain the association of CCN3 with carcinogenesis and its pattern of expression in normal conditions
-
The addition of CCN3 and CCN2 to glioblastoma and neuroblastoma cells caused a pronounced but transient increase of intracellular calcium, originating from both the entry of extracellular calcium and the mobilisation of intracellular stores, so that voltage independent calcium channels might be of considerable importance for the regulation by CCN3 of the calcium flux associated with cell growth control, motility, and spreading
-
These observations assign for the first time a biological function to the CCN3 protein and indicate a broader role for the CCN proteins in calcium ion signalling
The physical interaction of CCN3 and S100A4 now extends the range of interactions to the CCN family of cell growth regulators, whose role in controlling fundamental aspects of cell survival and multiplication is becoming increasingly important. This interaction raises a question regarding their biological site of interaction. S100A4 has been described as essentially a cytoplasmic protein; however, there is evidence for the existence of extracellular S100A4. For example, S100A4 was secreted by bovine aortic smooth muscle cells, rat embryo fibroblasts 3Y1, and periodontalm ligament cells in culture.52–54 Furthermore, S100A4 binds to the 36 kDa extracellular matrix microfibril associated glycoprotein. The CCN3 proteins have been detected in extracellular matrix, in conditioned cell culture medium, in the cytoplasm, and in the nucleus.11–13,17 Whether the interaction of CCN3 and S100A4 takes place within the cell, in the extracellular matrix, or in both regions, remains to be established.
The S100A4 gene belongs to a cluster of 13 S100 genes, which are found on human chromosome 1q21,55–58 with a high degree of conservation when compared with the mouse chromosome 3.59 Considering that this region has been reported to be rearranged frequently by deletions, duplications, and translocations during carcinogenesis, one could expect that the expression of this gene cluster might be affected in cancer cells. Indeed, the expression of S100A4 has been associated with several aspects of carcinogenesis, including increased malignancy of cancer cells and poor prognosis.60–68 S100A4 has also been reported to be a metastatic factor that might induce tumour progression via the stimulation of angiogenesis.69–73
The physical association of CCN3 and S100A4 that we have uncovered is in agreement with the association of both proteins with cancer development and metastasis.
We have previously reported that the expression of a truncated CCN3 protein in chicken primary fibroblastic cells induces morphological transformation,8 and that in some human tumours the expression of CCN3 is associated with increased proliferative capacity of cancer cells. Furthermore, the expression of CCN3 in primary Ewing’s tumours is associated with a higher risk of developing metastasis.21 Conversely, we have shown that in human glioblastomas, the expression of nov interferes with tumorigenicity and cell growth.25 The fact that S100A4 values were not greatly increased in human astrocytomas and glioblastomas74 might be relevant. It will be interesting to establish whether these differences can be related to differential S100A4 concentrations, changes in calcium signalling, or altered interactions between CCN3 and S100A4.
“The connection with calcium signalling opens new avenues that should help to decipher the role of the CCN regulatory proteins in processes governing cell growth control, development, and normal and pathological physiology”
Another aspect of the relation between CCN3 function and calcium signalling was raised by the pronounced increase in intracellular calcium concentration, which was transiently induced in CCN3 treated G59 and SK-N-SH cells. The results obtained with blockers of voltage dependent calcium and sodium channels allowed us to distinguish between two different activities of CCN3. In G59 cells, both entry and the mobilisation of the internal calcium store were induced by the addition of CCN3, whereas only the entry of external calcium was induced in SK-N-SH cells. Because the inhibitory effect of EGTA upon the calcium increase was reversed after the addition of CaCl2, CCN3 is unlikely to be a ionophore by itself.
The uptake of extracellular calcium induced by CCN3 proceeded even when voltage dependent channels were blocked. Therefore, it is tempting to speculate that it involves store operated calcium channels, a heterogenous subset of plasma membrane calcium ion channels. The best characterised channel of this type was originally described in mast cells in which the depletion of calcium induced a sustained calcium inward current that was not voltage activated and therefore termed ICRAC (for calcium release activated calcium).75–77
The mobilisation of intracellular calcium stores by CCN3 in G59 cells might involve specific receptors and IP3 activated channels. Along this line, the interaction of CCN1, CCN2, and CCN3 proteins (B Perbal, unpublished data, 1997)78–80 with integrins might be of relevance. It is well established that the binding of integrins with their ligands frequently results in a transient increase of intracellular calcium values and that calcium transients can mediate intracellular changes that feed back to the integrins as part of the “inside out signalling” mechanism. The binding of calcium is required for the optimal binding of ligands to integrins, the typical extracellular α chain domain of which contains four EF hand calcium binding sites.
The lack of response of SK-N-SH cells to GST–NH25 in the absence of an extracellular pool of calcium might result from differences in the receptors found in these cells, or from biochemical variations in the treatment of information resulting from the presence of an inhibitor or the lack of a transmitter in SK-N-SH cells.
In addition to integrins, CCN3 can interact with fibulin 1C and NOTCH1, both of which contain calcium ions in their EGF-like motifs. It will be interesting to determine whether the regulation of intracellular calcium concentrations by CCN3 affects in any way its association with these proteins and their biological activities.
The interaction of CCN3 with S100A4 and its ability to induce a transient increase of intracellular calcium by two different mechanisms add another degree of variety to the pleiotropic biological properties of the CCN proteins. The connection with calcium signalling opens new avenues that should help to decipher the role of these regulatory proteins in processes governing cell growth control, development, and normal and pathological physiology.
Acknowledgments
We are indebted to Professor B Roizman for hosting Professor B Perbal and providing facilities to run the two hybrid screening. Thanks also to Dr R Brandimarti and JM Dupret for stimulating discussion and to A Perbal for her administrative help. The technical assistance of Y Gabadhino is acknowledged. This work was funded by grants to BP from Association pour la Recherche contre le Cancer (ARC), Ligue Nationale contre le Cancer (Comités du Cher et de l’Indre), Ministére de l’Education Nationale, and de la Recherche et de la Technologie (MENRT). CLL and VM were recipients of a fellowship from the Ligue Nationale Contre le Cancer (Comités du Cher et de l’Indre).
REFERENCES
- 1.↵
- 2.
- 3.
- 4.↵
- 5.↵
- 6.
- 7.↵
- 8.↵
- 9.↵
- 10.↵
- 11.↵
- 12.↵
- 13.↵
- 14.↵
- 15.↵
- 16.↵
- 17.↵
- 18.
- 19.
- 20.↵
- 21.↵
- 22.↵
- 23.↵
- 24.↵
- 25.↵
- 26.↵
- 26a.↵
- 27.↵
- 28.↵
- 29.↵
- 30.↵
- 31.↵
- 32.↵
- 33.↵
- 34.↵
- 35.↵
- 36.↵
- 37.↵
- 38.↵
- 39.↵
- 40.↵
- 41.↵
- 42.↵
- 43.↵
- 44.↵
- 45.↵
- 46.↵
- 47.↵
- 48.
- 49.
- 50.
- 51.
- 52.↵
- 53.
- 54.↵
- 55.↵
- 56.
- 57.
- 58.↵
- 59.↵
- 60.↵
- 61.
- 62.
- 63.
- 64.
- 65.
- 66.
- 67.
- 68.↵
- 69.↵
- 70.
- 71.
- 72.
- 73.↵
- 74.↵
- 75.↵
- 76.
- 77.↵
- 78.↵
- 79.
- 80.↵
Footnotes
-
This paper follows the nomenclature proposed by the International CCN Society (http://ccnsociety.jussieu.fr).